This graph is a somewhat different visualization of user activity on the One True Thread of Time, using my own peculiar ranking system. Each OTTer gets a ranking based on three factors: total number of posts, length of time active on the thread, and something I call "regularity"—how uniform the frequency of their posting activity has been.
As usual, don't take this too seriously. My calculations make no distinction between someone posting a "LOL" and BlitzGirl posting another Boom De Yada. This is just for fun—it's not intended to be a serious analysis of anyone's contribution to the OTT.
Disclaimer: I like finding ways to visualize numbers, but I am not a mathematician (much less a statistician); I just played one briefly in college (thirty-odd years ago).
The user ranking is a straight product P · A · R of three values: post count; active interval; and regularity.
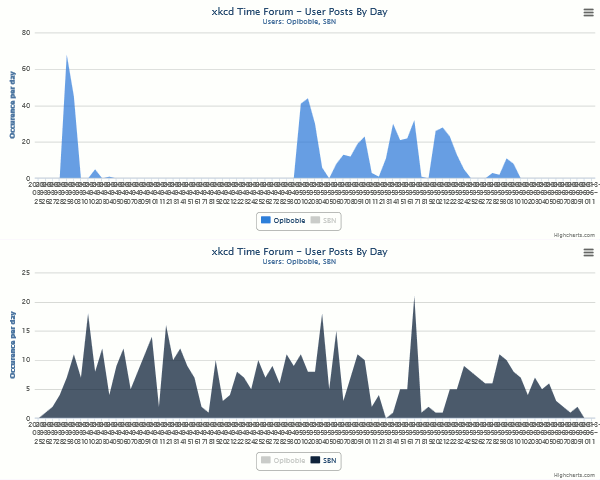
Regularity is why SBN and Opiboble are so far apart, even though they have nearly the same number of posts over nearly the same span of time. But SBN posted nearly every day, and Opiboble posted in big spurts, like this:

Also, KarMann maintained a high presence on the OTT for its first fifty-odd days, as can be seen on an earlier version of this graph. But then he didn't post for nearly five weeks. He returned just before the data for the graph above was collected, but the long gap dropped his regularity score from .397 to .084, dropping him a good ways down the graph. Sorry, KarMann!
A final note: I lack the code-fu to distinguish between mscha and newpixbot. This graph combines their post activity, which improves their joint ranking both by regularity and by post count.